Information Visualization Techniques
AlphaSlider
[AHLB94]Description
- RSVP: rapid, serial, visual presentation of text
- uses a small rectangle
- for rapidly scanning or searching lists
- novice users can locate 1 of 10000 entries in 24 seconds
- possible uses: phone directories, PDAs, laser disk players ( frames), electronic calendars.
- An alternative to menus and scrolling lists.
- Text scrolls horizontally (called Times Square format).
Advantages
- contains only valid input choices
Disadvantages
- good for expert users, but not for novices.
- hard to do fine tuning work while holding down the mouse button

Animation
[ROBE93] [ROBE91a] [ROBE91b]Description
Animation keeps the user from becoming disoriented when the system rearranges the data to present a new visualization display. When using animation, the system creates a smooth transition between one view and another.
see animated cone tree papers: (listed at top)
Advantages
Disadvantages
Butterfly Citation Browser
[HEAR96] [MACK95]Description
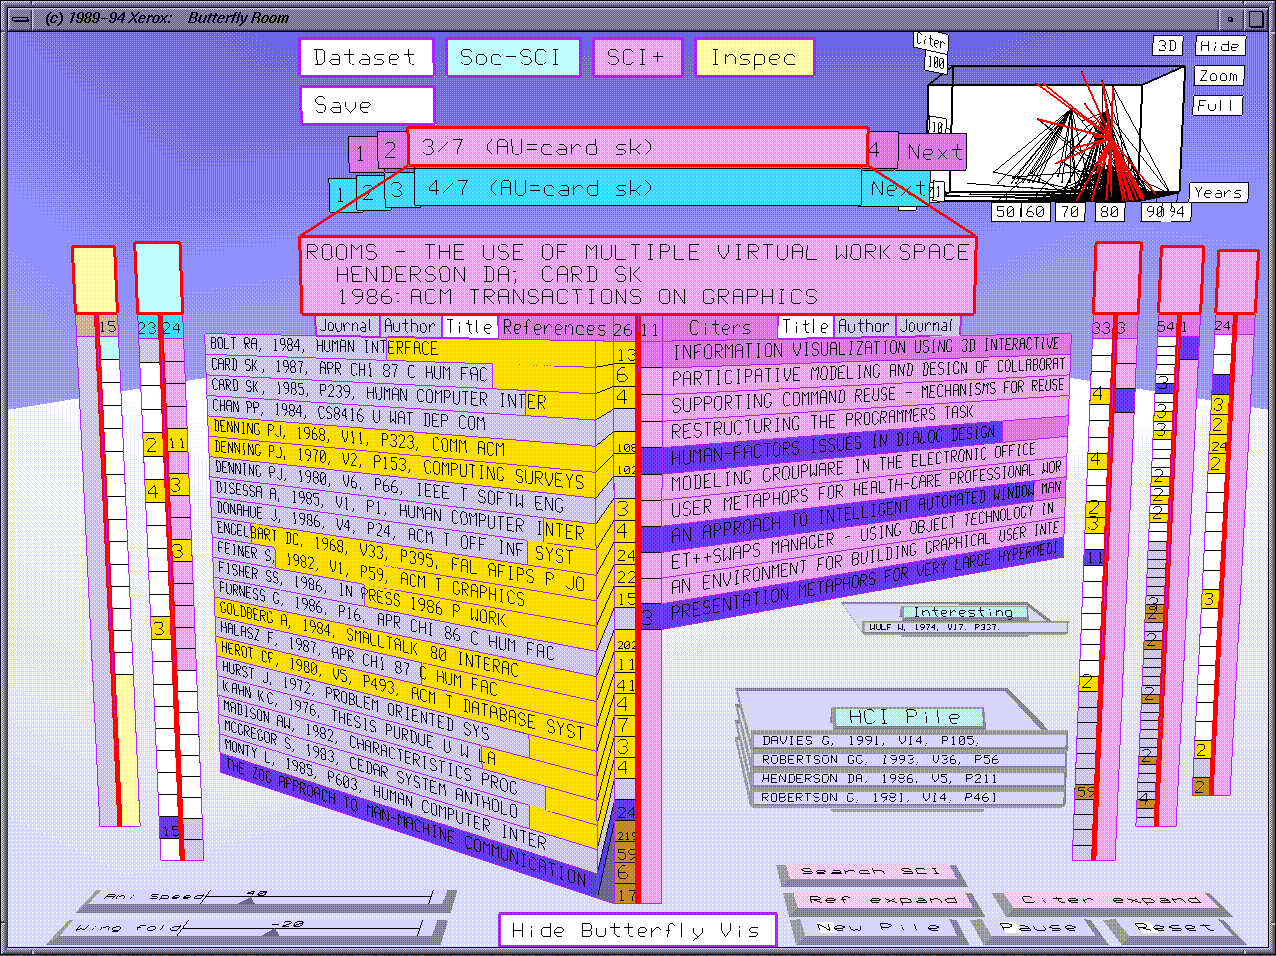
The butterfly's head shows a summary of the bibliographic information for an article. The wings show the article's references on the left and citers of the article on the right. Clicking on an item in one of the wings retrieves that bibliographic record. [RAO]
Advantages
Disadvantages
[picture with [MACK95] on the WWW]
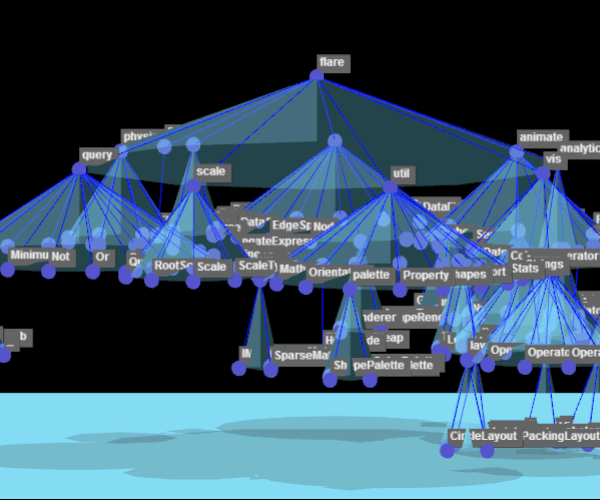
Cone Tree
[ROBE91a] [ROBE91b] [ROBE93] [CARR95]Description
For hierarchical data.
Bring any node to the front by clicking on it, which smoothly rotates the tree.
Advantages
Good for evenly-balanced trees.
Disadvantages
- Large 2D trees become too cluttered.
- currently limited to roughly 1000 nodes, 10 layers, branching factor of 30 [PEAR]
- large computational requirements [PEAR]
- incapable of displaying multiple hierarchical data structures [PEAR]
Data Sphere
[PEAR93] (contains criticisms of tree maps and cone trees)Description
Advantages
Disadvantages

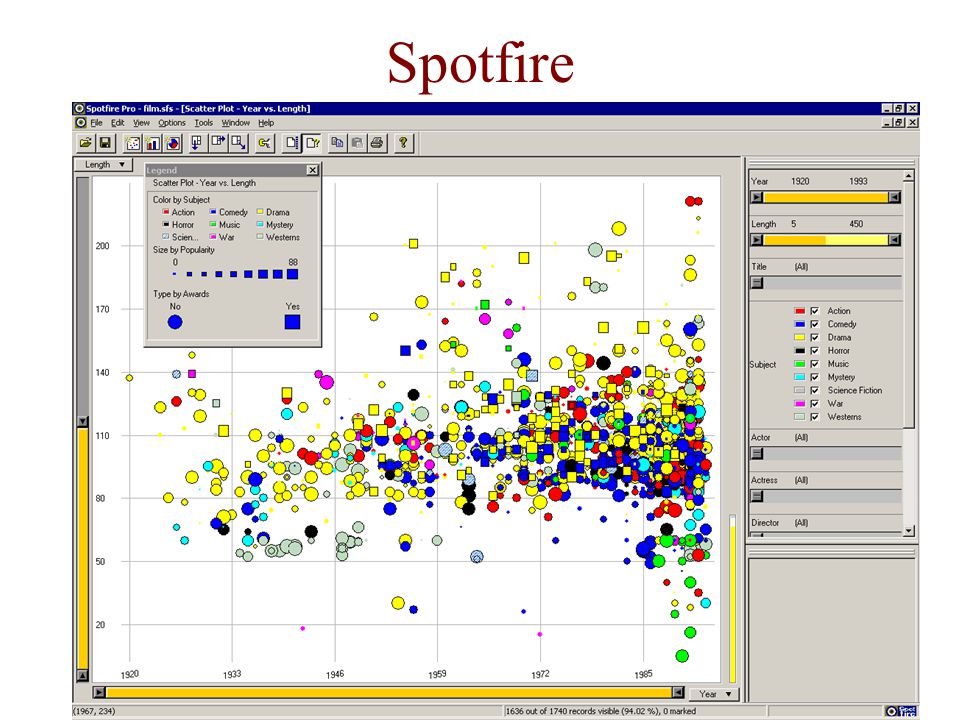
Dynamic Queries
[AHLB92] [SHNE94]Description
This technique allows the user to change the query parameters and see the display update in real time.
Dynamic queries continuously update search results—within 100 milliseconds—as users adjust sliders or select buttons to ask simple questions of fact or to find patterns or exceptions. [SHNE94]
- interactive control
- visual query parameters
- rapid display update
- animated display
- visual presentation of query components
- visual presentation of results
- rapid, incremental and reversible control of the query
- selection by pointing, not typing
- immediate and continuous feedback
Advantages
users can quickly discover...
- which areas are densely populated vs. sparsely populated
- clusters
- exceptions
- gaps
- outliers
- trends
- patterns
Disadvantages
- poorly matched with current hardware and software systems
- can't do rapid database searches
- can't do rapid graphical display updates
- requires application-specific programming
- limited to conjunctions of disjunctions and range queries on numeric values
- not suitable for visually handicapped users
Fisheye Views
[SARK92] [SARK94]Description
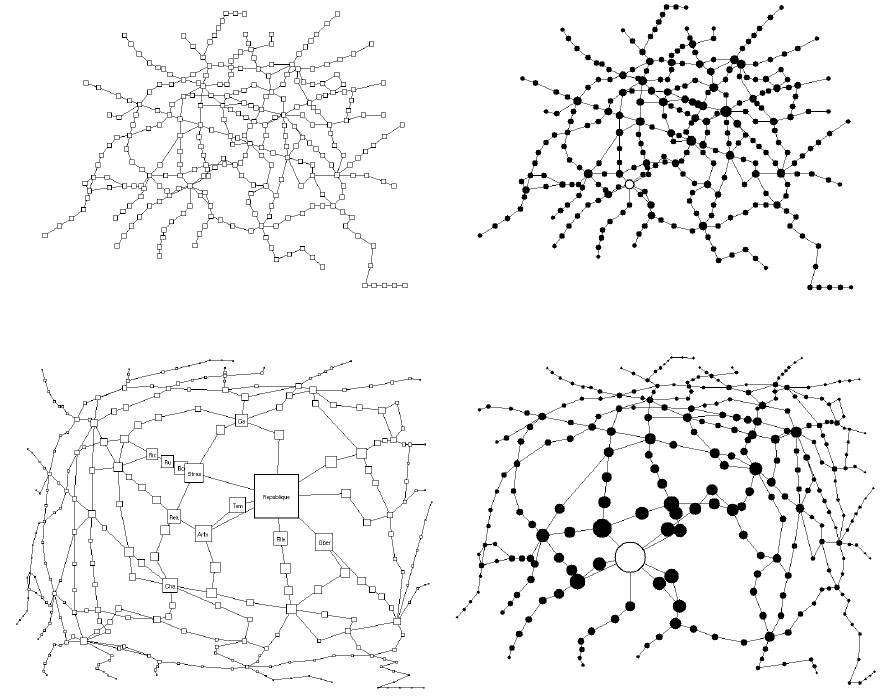
a fisheye view of a graph shows an area of interest quite large and with detail and shows other areas successively smaller and in less detail. it achieves this smooth integration of local detail and global context by repositioning and resizing the elements of the graph. [SARK94]
cartesian vs. polar transformations
A cartesian transformation has the property that all the vertical and horizontal lines remain vertical and horizontal after the transformation. [SARK94]Advantages
user can control the distortion factors
Disadvantages
- Always keeps all the information on the screen, which gets cluttered.
- There is no satisfactory 2D layout of a large tree, because of exponential growth.
Fractal Tree
[KOIK93] [KOIK95]Description
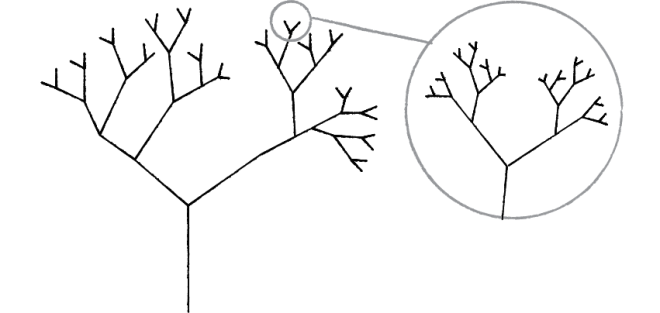
- most important property is the ability to control the amount of information displayed [KOIK93]
- total amount of information is kept nearly constant even when users change focus [KOIK95]
- this amount (of information) can be set flexibly [KOIK95]
Advantages
- lets you display a larger number of nodes [KOIK93]
- easier to change focus than cone tree; requires fewer mouse actions [KOIK93]
Disadvantages
Hyperbolic Tree Browser
Description
The essence of this scheme is to lay out the hierarchy in a uniform way on a hyperbolic plane and map this plane onto a circular display region. This supports a smooth blending between focus and context, as well as continuous redirection of the focus. [LAMP95]
- components diminish in size towards the edges of the display
- exponential growth in the number of components means we can display an infinite number of components
- focus is in the center of the display, but the tree can be moved so a different node is placed at the focal point
- can display 1000 nodes, of which the nearest 50 can have text labels (2D browser can display only 100 nodes with 3-character labels)
The circumference of a circle on the hyperbolic plane grows exponentially with its radius, which means that exponentially more space is available with increasing distance. Thus hierarchies—which tend to expand exponentially with depth—can be laid out in hyperbolic space in a uniform way, so that the distance (as measured in the hyperbolic geometry) between parents, children, and siblings is approximately the same everywhere in the hierarchy. [LAMP95]
Advantages
Can display a similar number of nodes as can the cone tree, but doesn't require 3D animation support. Relatively modest computation needs because it's 2D. This makes it useful on a wider variety of platforms.
displays more of a node's context in all directions (ancestors, siblings, and descendants) than the fractal layouts.
Disadvantages

Movable Filter
[STON94] [FISH]Description
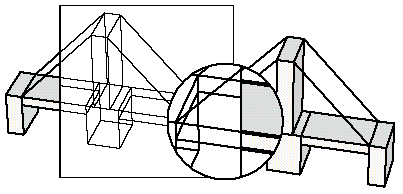
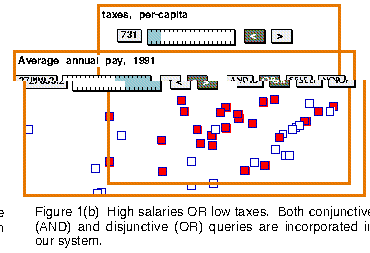
"...queries generated by these [other] systems are limited to conjunctions of global ranges of parameter values... we extend dynamic queries by encoding each operand of the query as a Magic Lens filter. Compound queries can be constructed by overlapping the lenses. Each lens includes a slider and a set of buttons to control the value of the filter function and to define the composition operation generated by overlapping the lenses." [FISH]
used in conjunction with a starfield display (aka scatterplot)
"We define for each filter a filtering function and a composition mode that describes how the result of the filtering function is combined with the output of the lenses underneath...the NOT operation can be encoded as a lens whose filter inverts the sense of the data coming in...to incorporate grouping...we provide an operation that replaces a stack of lenses with a single compound lens that is semantically equivalent." [FISH]
Real-valued queries
"Filters assign a real-valued score on the range [0..1] to each datum. Data with a score of 0 fails the filter entirely, data with a score of 1 succeeds entirely, and data with intermediate scores partially satisfy the filter." [FISH]
- replace AND with MIN
- replace OR with MAX
- replace MAX with 1-x
- replace TRUE and FALSE with a THRESHOLD
Advantages
Disadvantages
When used as a magnifying lens, introduces discontinuities at the boundaries of the lens.
Multiple Views
[MUKH95b] [MUKH95a]Description
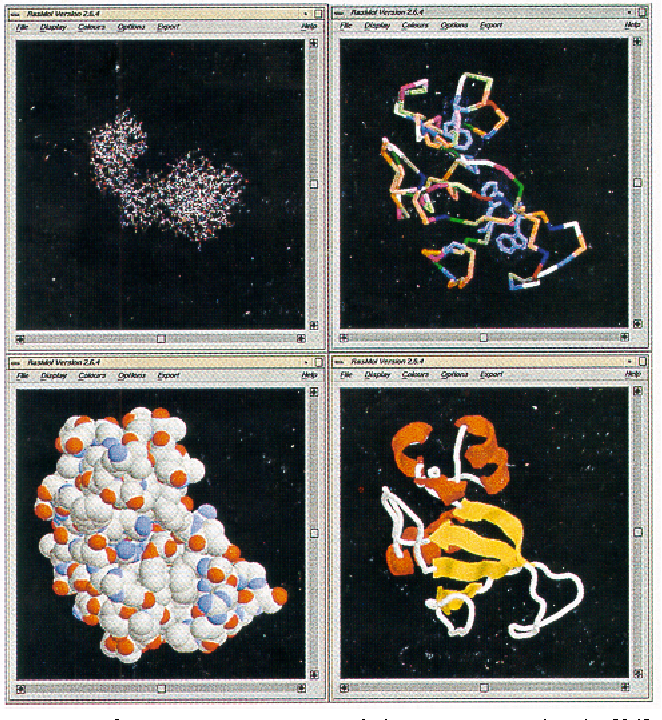
provide the user with different hierarchies, each giving a different perspective on the underlying information space
networks are much harder to visualize then hierarchies uses a data structure called the pre-tree to convert a generalized graph into a tree
Two methods of clustering:
- content analysis - based on attributes of the nodes
- structural analysis - based on the structure of the subtrees
Three metrics for ranking possible pre-trees:
- information lost in pre-tree formation (= entropy?)
- "treeness" of the branches - similarity of the pre-tree to an actual tree
- "goodness" of the root - look for shortest sum-of-distance from root to all other nodes
Advantages
Disadvantages
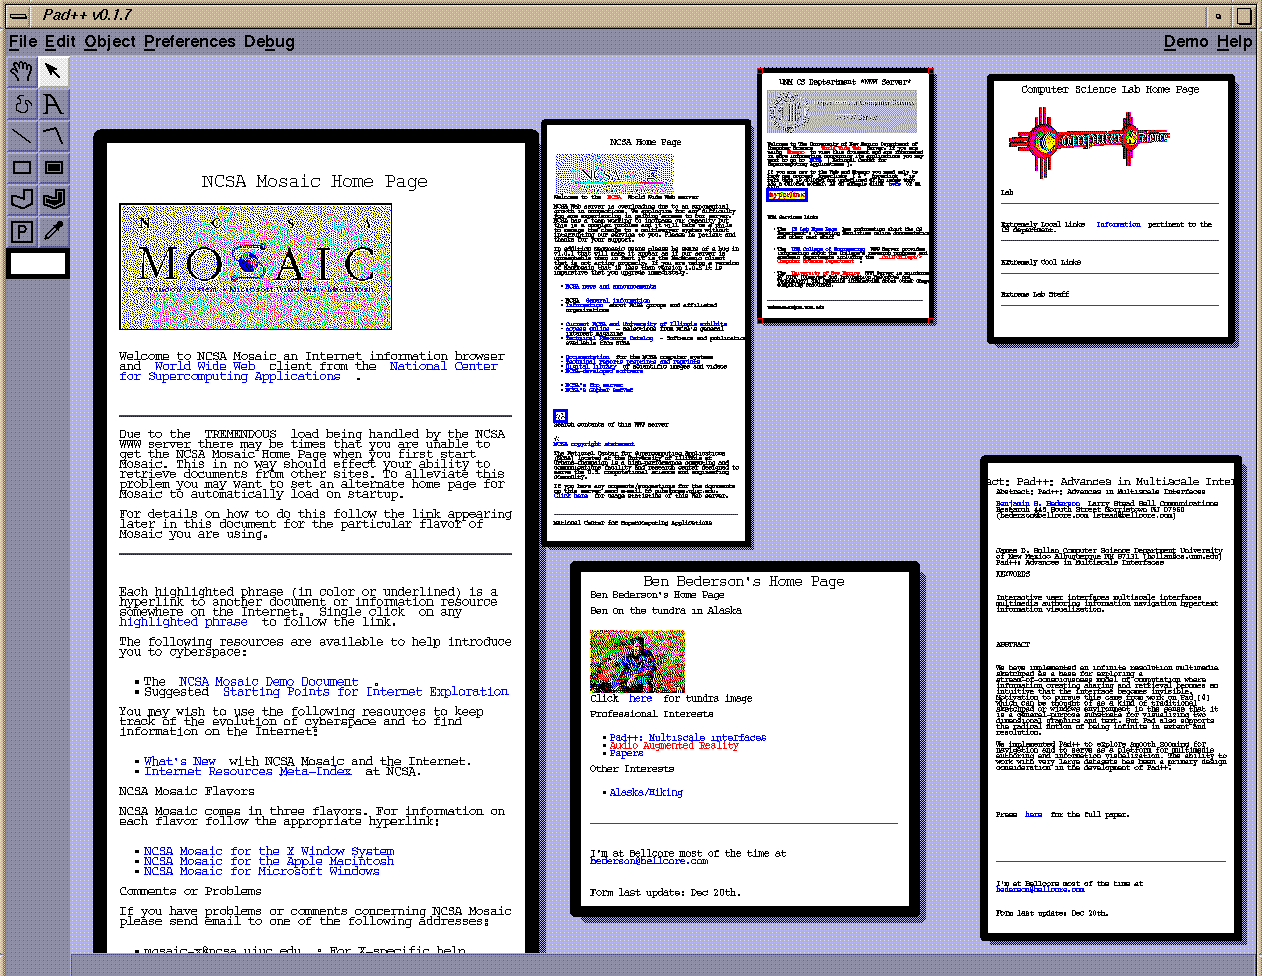
Perspective Wall
[MACK91]Description
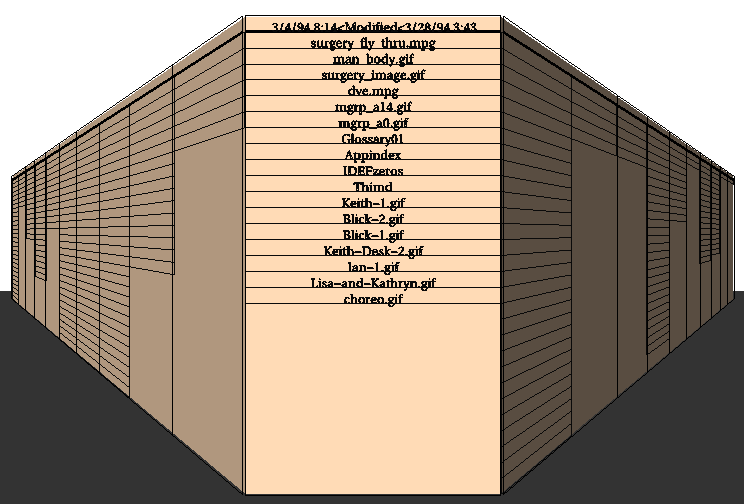
for linearly-structured data
examples of linear data:
- chronological
- alphabetical
two principal obstacles to visualizing linear information structures:
- large amount of information that must be displayed
- difficulty of accommodating the extreme aspect ratio of the linear structure on the screen
descendant of the bifocal display (look it up!)
Advantages
smooth transitions: moves as if a piano roll
Disadvantages
Query Spreadsheet / Information Crystal
[SPOE93]Description
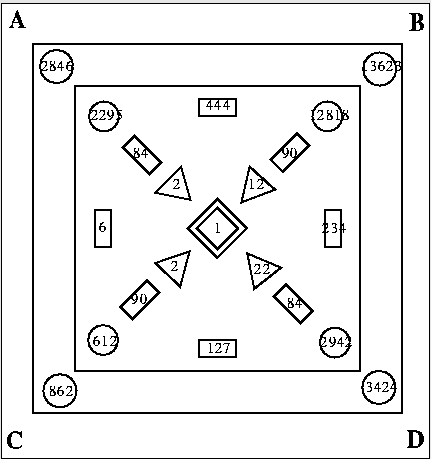
create a boolean query as a venn diagram.
nest queries to create more complex queries.
boolean spreadsheet is an iconic display that shows the results of the query
(not a tool for creating the query) ( is this true? )
however, the results can be combined visually into more complex queries?
the result is a kind of raking in which groups closer to the center of the spreadsheet satisfy more of the boolean query than groups on the periphery of the spreadsheet.
Advantages
Disadvantages
Scatter/Gather and Iterative Query Refinement
[HEAR96] [PIRO95] [RAO]Description
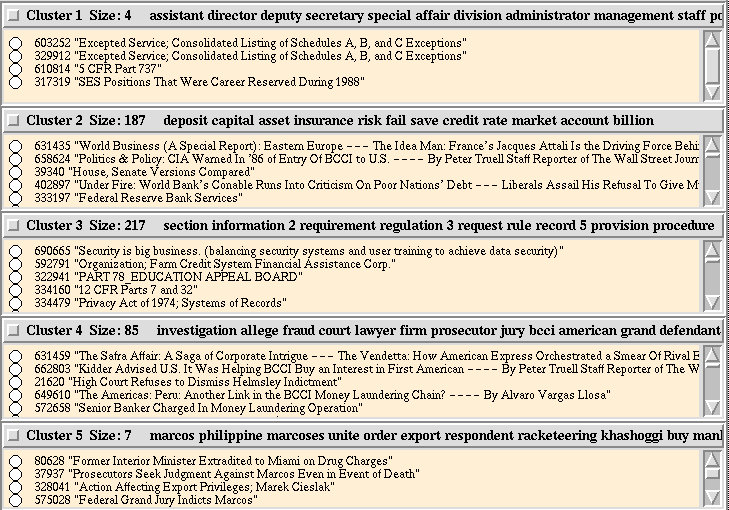
This technique allows the user to repeatedly sift information using successive queries that eventually pinpoint the data of interest.
"A browsing paradigm...which allows a user to rapidly assess the general contents of a very large collection by scanning through a hierarchical representation that acts like a dynamic table of contents. Initially the system scatters, or clusters, the collection into a small number of document groups, and present short summaries of the groups to the user. These summaries consists of two types of information: topical titles (titles of documents close to the cluster centroid) and typical terms (terms of importance in the cluster). Based on these summaries, the user selects one or more of the groups for further study. The selected groups are gathered, or unioned, together to form a subcollection. The system then reapplies clustering to scatter the new subcollection into a small number of document groups, which are again presented to the user. With each successive iteration the clusters become smaller, and their contents more refined. The user may, at any time, switch to a more focused search method." [RAO]
"The document clustering algorithm is optimized for speed, to encourage interaction, rather to guarantee accuracy." [HEAR96]
IQR is really from Xerox, Scatter/Gather.
"...emphasizes the participation of the user in a cycle of query formulation, presentation of search results, and query reformulation. Since the focus is on query repair, the information presented is typically not document descriptions, but rather intermediate information indicating relationships between the query and the retrieved documents." [RAO]
Advantages
Disadvantages
SeeSoft
[EICK95]Description
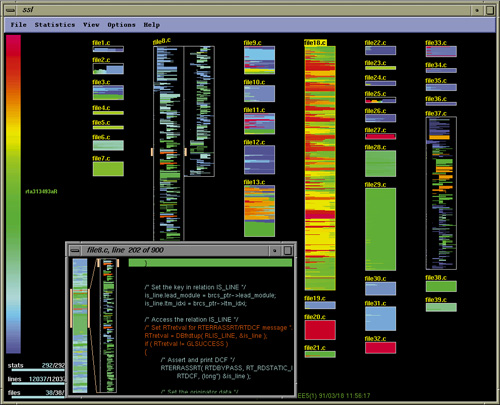
Used for text-change tracking.
Displays indentation, line lengths, and paragraphs in miniature.
Color coding indicates last modification date.
Shows the distribution of the salient property (eg modification date).
column lengths indicates relative file sizes
four key ideas:
- reduced representation. display files as as columns and lines of code as thin rows.
- >coloring by statistic. for example, date of modification or creation
- direct manipulation
- capability to read actual code
Advantages
Disadvantages
Starfield Displays
[SHNE96] [JOG]Description
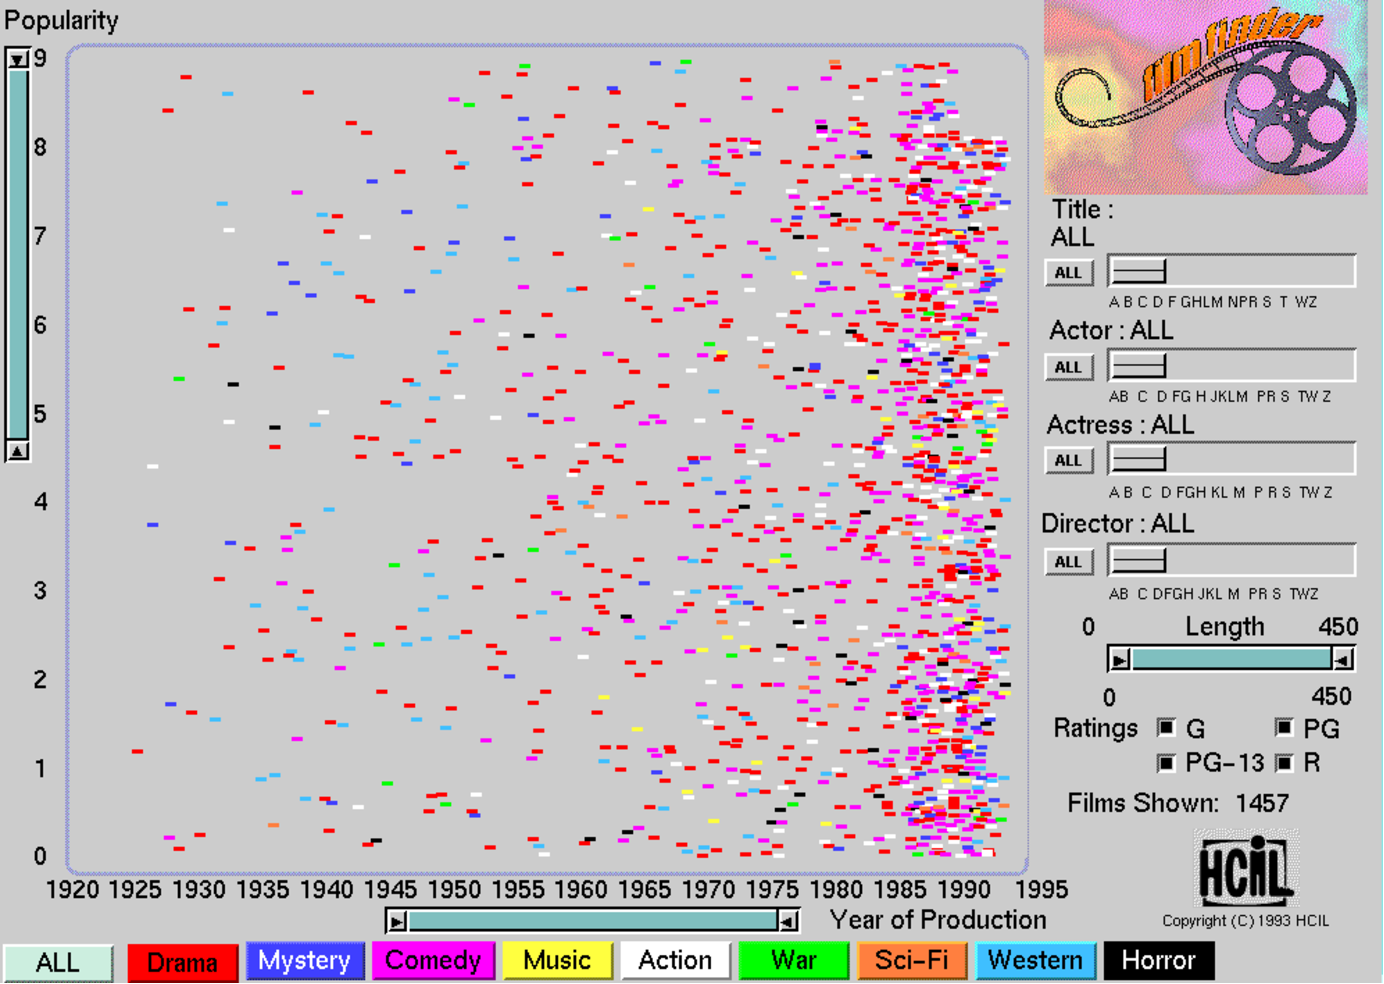
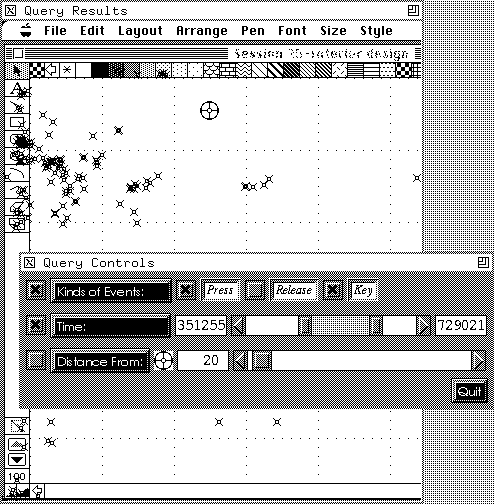
Starfield displays plot items from a database as small selectable glyphs using two of the ordinal attributes of the data as the variables along the display axes. [JOG]
Advantages
Disadvantages
Tile Bars
[HEAR95] [HEAR96] [RAO]Description
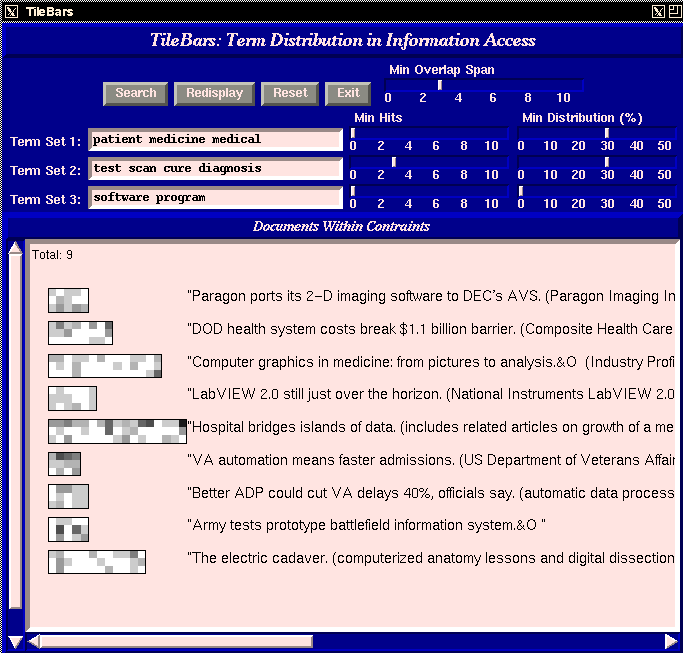
"...the TileBars interface allows the user to make informed decisions about which documents and passages to view, based on the distributional behavior of the query terms in the documents. The goal is to simultaneously and compactly indicate (i) the relative length of the document, (ii) the frequency of the term sets in the document, and (iii) the distribution of the terms sets with respect to the document and to one another." [RAO]
"This paper argues for making use of text structure when retrieving from full text documents, and presents a visualization paradigm, called TileBars, that demonstrates the usefulness of explicit term distribution information in Boolean-type queries. TileBars simultaneously and compactly indicate relative document length, query term frequency, and query term distribution. The patterns in a column of TileBars can be quickly scanned and deciphered, aiding users in making judgements about the potential relevance of the retrieved documents." [HEAR95]
shows where terms overlap in the document
an alternative to ranking the results of boolean queries
Advantages
Disadvantages
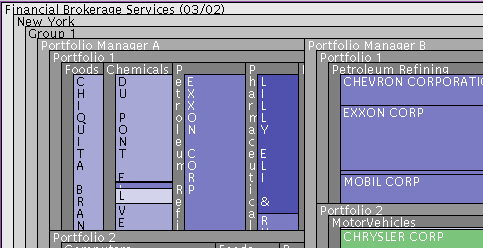
TreeMaps
[JOHN92] [JOHN91]Description
Should be under focus+context?
For hierarchical information.
Used for seeing hard disk space and structure.
an alternative to listings, outlines, and tree diagrams (but not to other IV techniques!)
visual display properties:
- color (hue, saturation, brightness)
- texture
- shape
- border
- blinking
Advantages
- Use all available screen space by using rectangular boxes.
- easy to spot the largest files, or the largest files of a particular type
- easy to spot new/old files (creation/modification dates)
Note: easy to spot minima or maxima, but sometimes relevancy isn't determined by some extreme valuation.
Disadvantages
- lacks an effective method for zooming [PEAR]
- screen becomes too densely packed [PEAR]
- tends to obscure the hierarchical structure of the values [LAMP95]
- provides no way of focusing on one part of the hierarchy without losing the context [LAMP95]
Zoom Bar
[JOG]Description
A new widget for zooming and panning. Instead of zooming towards or away from a focal point, zoom towards or away from a fixed line. Filter by changing the range of displayed values on one of the axes.
Zooming a starfield display should be incremental and flicker-free so that users can track the motion of each rectangle. [JOG]
Utilized in the Film Finder.
Purposes of zooming
- reveal detail
- reduce clutter
Advantages
Why zoom bar is better than camera-type zooming:
- only one dimension at a time means less disorientation for the user. (?)
- only one end of the slider at a time means the data moves away from one edge of the window (the focal line) instead of both,less disorienting for the user. (?)
Disadvantages
